Interpreting Physical Results
Every stream, from headwaters to final destination, is an ever-changing habitat. Water temperature, width, depth, velocity, substrate, and volume of flow directly influence the diversity of animals that inhabit a stream. The cool temperatures of a mountain stream and the warm waters of a large river support vastly different species and numbers of aquatic organisms. Measuring these parameters allows us to anticipate what species we may find, and it may help to identify causality when data results change from previous investigations.
Stream Temperature
The stream temperature range over a period of time is an indication of which aquatic species may or may not be present. The stream temperature will vary throughout the year and even throughout the day, but it will not vary as much as the air temperature because water takes longer to gain or lose heat. This is important to aquatic creatures which do not have as many choices as their land counterparts for adapting to temperature changes. Stream temperature is influenced by the amount of water feeding into the stream from underground springs, by the amount of shade, by the volume of the water itself, and by the amount of agitation. Water agitation causes evaporation, which in turn causes heat loss. Industry often uses water to cool equipment; discharging the warmed water back into the waterway.
Temperature also affects aquatic life’s sensitivity to toxic wastes, parasites, and disease, either due to stress of rising water temperatures or the resulting decrease in dissolved oxygen.
Temperature and dissolved oxygen are closely related: the warmer the water, the less dissolved oxygen. Warmwater species can be found in lakes and large rivers; coldwater species in small streams.
Temperature ranges of some species:
- Warmwater species (70 degrees F and up) largemouth bass, crappie, bluegill, carp, catfish, caddisfly
- Coolwater species (65 to 70 degrees F) perch, sauger, walleye, smallmouth bass, pike, muskellunge, pickerel, rock bass, stonefly, mayfly, caddisfly, water beetles
- Coldwater species (70 degrees F and below) trout, salmon, caddisfly, stonefly, mayfly
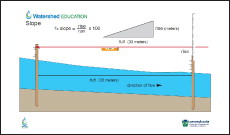
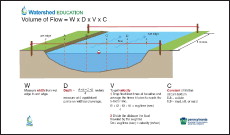
Velocity and Volume
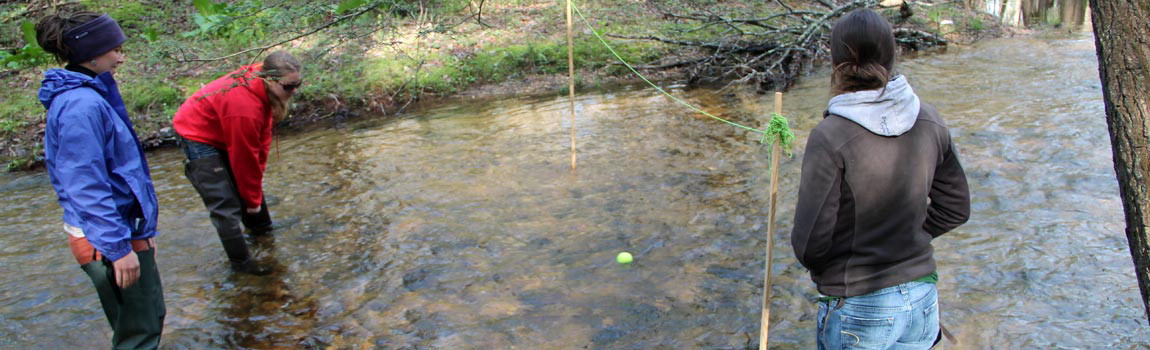
The speed at which stream water flows is called its velocity; the amount of water it carries is its volume.
The three main variables affecting velocity are:
- How much the stream drops per mile (usually expressed in feet)
- How curvy the stream is
- The shape of the stream's bottom (its profile)
 Obviously, the steeper the drop, the faster the stream moves. Less obvious is the composition of the stream's bottom and how curves affect its flow. If all other factors are equal, a stream with a smooth bottom will carry sediments and water faster than a stream with a rough, rocky bottom. When calculating stream volume, a standard coefficient is used to represent the stream bottom type.
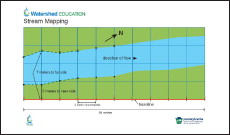
Curves slow down a stream just like they slow down a car. The water on the outside of the curve moves faster than the water on the inside; thus eroding the outside bank and channel more rapidly than on the inside. For this reason, streams are always fastest and deepest on the outside bend - a good reason to stay away from these places in very high water (or to purposely seek them in low water).
For purposes of flood control, a straight, smooth bottom is best because it will carry water downstream most rapidly. However, a good habitat for fish and aquatic animals requires a rough bottom with lots of rocks, holes, and submerged logs.
The velocity of a stream can change from day to day or year to year. After a major rain, the velocity and volume will usually increase; during a drought they will decrease. Velocity also varies from point to point along a stream. Usually, a stream picks up speed where it narrows, and it loses speed where it widens.
WE Physical Data sheet pdf (47 kb)
Learn more about Pennsylvania’s streams with StreamStats Program from the US Geological Survey http://water.usgs.gov/osw/streamstats/pennsylvania.html
Supplemental Charts for teaching Watershed Education
These are for educational use only. They may be printed, but they cannot be sold or altered. Please give credit to DCNR- Bureau of PA State Parks. For best results, print in color on ledger size (11 X 17) or larger paper.